Day 1: State and Define Daily Objective
Students will use the line of best fit to find equations of lines.
The definition of this objective is referring to the system of equations in which the slope and intercept points on a graph are found, and then used to find the line of best fit. This is building on past units where we use the slope of a line to find an equation. It explains the important step of first using a scatter plot to make a line.
Day 1: Pictures and Graphs to Represent the Objective

Line of best fit us represented in this picture by illustrating the two points which the line of best fit intercepts. In this graph, the line of best fit is representing the effect that change in temperature has on the amount of money spent.

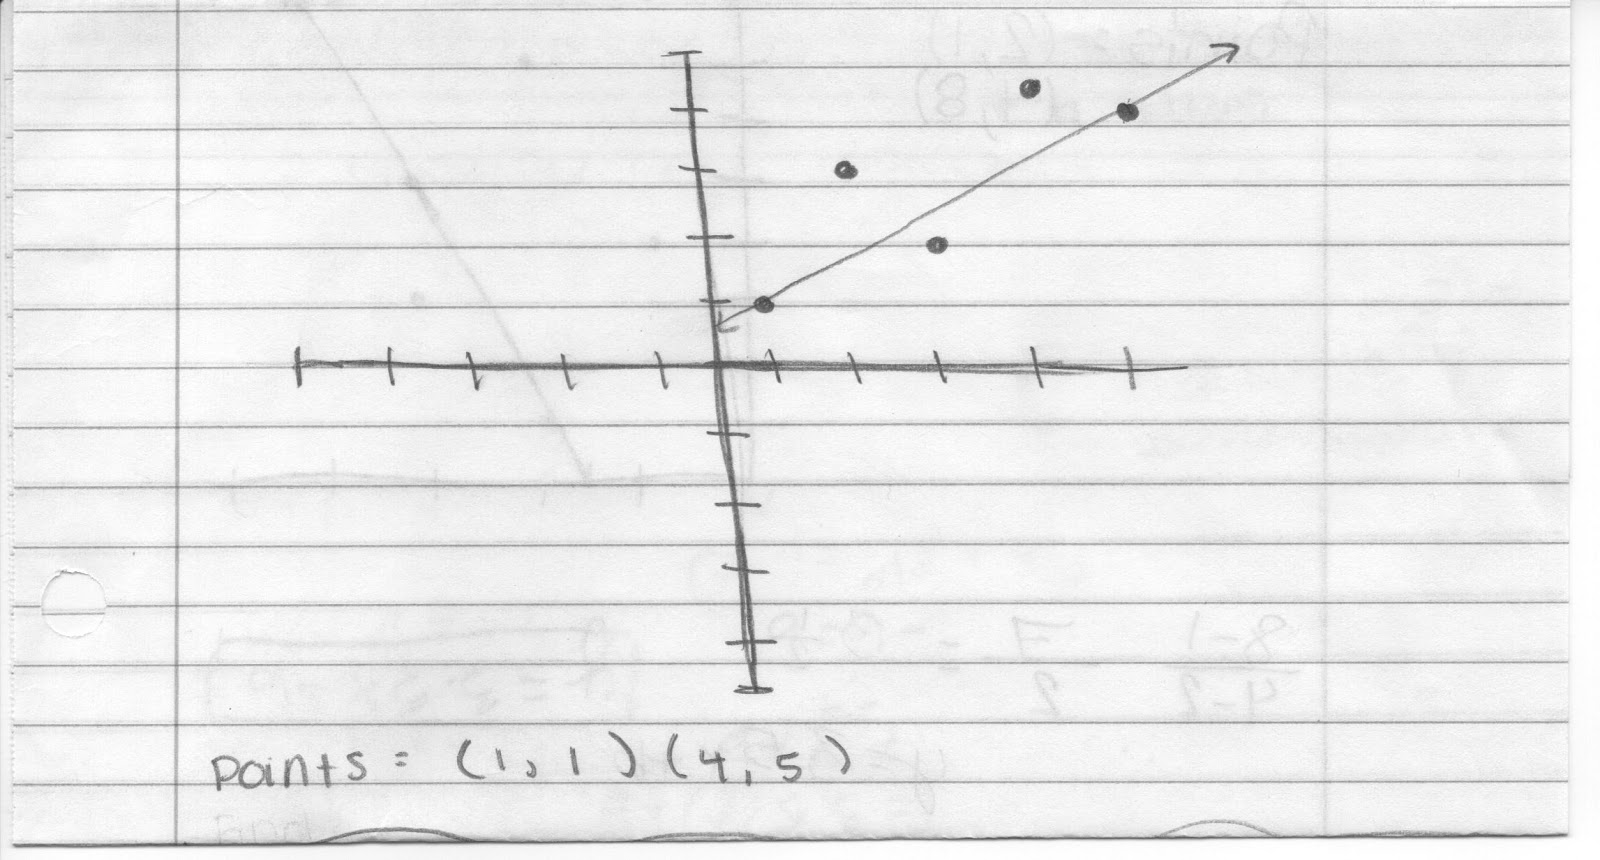
Line of best fit is properly represented in this graph by making a clear example that the line of best fit intercepts the middle/ average points. The line of best fit intercepts two points or more, and has points on either side of the line.

Quiz Time!
There will be 3 questions, with answers and explanations following.
1. For the following graph, use the line of best fit to find the equation of the line.
2. For the following graph, use the line of best fit to find the equation of the line.

3. For the following graph, use the line of best fit to find the equation of the line.

Key
1.

2.


No comments:
Post a Comment